


Abstract
The impact of serum lipid abnormalities on the progression of diabetic kidney disease (DKD) remains conflicting. Furthermore, gender differences in the association between dyslipidaemia and outcome of DKD are largely unknown. We therefore conducted this single-centre observational cohort study to clarify gender differences in the association between serum lipid profiles and the progression of DKD.
Seven hundred and twenty-three Japanese type 2 diabetes mellitus (T2DM) patients with normoalbuminuria or microalbuminuria, 280 women and 443 men, with a mean (± SD) age of 63 ± 11 years were studied. The endpoint was the progression to a more advanced stage of albuminuria. For statistical analyses, Cox proportional hazard model analyses were conducted.
During the mean follow-up period of 4.3 years, 62 of 477 patients with normoalbuminuria and 69 of 246 patients with microalbuminuria reached the endpoint. A significant interaction between high-density lipoprotein (HDL) cholesterol and gender was detected (P interaction = 0.04); therefore, separate analyses were conducted for men and women. Overall, in men, the univariate Cox proportional hazard model revealed that higher triglycerides and lower HDL cholesterol levels were significantly associated with higher risk of reaching the endpoint. In the multivariate Cox proportional hazard model, only HDL cholesterol levels remained as an independent predictor of the endpoint (hazard ratio 0.391, P = 0.01). In women, no serum lipid parameters were associated with the endpoint.
Lower HDL cholesterol levels seem to be associated with the progression of DKD in men but not in women.
Introduction
Diabetic kidney disease (DKD) is the major cause of end-stage renal disease worldwide [ 1 ]; therefore, clarification of the mechanisms and identification of the risk factors associated with DKD are urgently required. Hyperglycaemia and hypertension are the two key factors relevant to increased risk of progression of DKD [ 2 ]. Dyslipidaemia has also been implicated in the pathogenesis of DKD. Experimental studies have clarified that altered lipid metabolism and excessive amount of lipid deposits in the kidney play an important role in the exacerbation of diabetic kidney disease [ 3 , 4 ]. However, the effects of lipid abnormalities on the progression of DKD in humans remain conflicting [ 2 , 5–7 ]. Observational studies have found that higher levels of serum triglycerides and low-density lipoprotein (LDL) cholesterol [ 2 ] and lower levels of serum high-density lipoprotein (HDL) cholesterol [ 5 ] were associated with progression of albuminuria. Whereas, no serum lipid parameters were found as predictors of the progression of DKD in other studies [ 6 , 7 ].
Gender differences in the association between serum lipid parameters and renal function decline have been recently reported in the general population [ 8 ]. In women, higher cholesterol-to-HDL cholesterol ratio was associated with rapid decline in renal function. In contrast, lower cholesterol-to-HDL cholesterol ratio was shown to be a predictor of renal function decline in men [ 8 ]. Interestingly, a cross-sectional study of male patients with type 2 diabetes mellitus (T2DM) showed that lipid abnormalities were associated with decreased glomerular filtration rate (GFR) [ 9 ]; however, this association was not observed in female patients with T2DM in another study [ 7 ]. Taken together, these findings may suggest that there are differences in gender in the association of serum lipid abnormalities with the pathogenesis of DKD; however, information is scarce in diabetic patients. We therefore conducted this single-centre observational cohort study to clarify the gender differences in the association between serum lipid profiles and the progression of DKD in T2DM patients.
Materials and methods
Participants
This was a single-centre observational cohort study on Japanese adult patients with T2DM. The subjects were recruited from ambulatory and hospitalized patients presenting at the Diabetes Centre, Tokyo Women’s Medical University Hospital, in Tokyo, Japan, during the period between January 2001 and December 2006. T2DM was diagnosed according to the Japan Diabetes Society criteria [ 10 ].
At a regular ambulatory visit or at the time of hospitalization, subjects underwent baseline anthropometric and physical examinations including height, weight and blood pressure. Laboratory examinations included serum levels of lipids, haemoglobin A1C (HbA1c) and creatinine in random spot blood samples and urinary albumin excretion measured in the first morning urine specimen. Patients with normoalbuminuria or microalbuminuria and an estimated glomerular filtration rate (eGFR) ≥15 mL/min/1.73 m 2 were enrolled in this study.
The study protocol was designed in adherence to the Declaration of Helsinki.
Measurements
HDL cholesterol level was determined by polyethylene glycol-pretreated enzymes, triglycerides by enzymatic methods, LDL cholesterol by enzymatic methods or Friedewald’s equation (if triglycerides < 400 mg/dL).
Urinary albumin level was measured by using the latex agglutination method and normalized by urinary creatinine. Urinary creatinine concentration was determined initially using Jaffe’s method (until January 2003) and using an enzymatic method thereafter. As the difference between the methods of urine creatinine concentrations were considered negligible, urine creatinine concentrations were not adjusted. The stage of albuminuria was defined as normoalbuminuria if urinary albumin-to-creatinine ratio (ACR) was <30 mg/g and microalbuminuria if ACR was 30–299 mg/g based on at least two of three consecutive urinary ACR measurements according to the American Diabetes Association (ADA) guideline [ 11 ]. GFR was estimated by using the following modified three-variable equation, as has been recently proposed by the Japanese Society for Nephrology: eGFR (mL/min/1.73 m 2 ) = 194 × age (years) −0.287 × serum creatinine (in mg/dL) −1.094 × (0.739 if female) [ 12 ]. Serum creatinine values measured by Jaffe’s method were calibrated, using the following equation, prior to inclusion in the equation: serum creatinine (enzymatic method in mg/dL) = 0.972 × serum creatinine (Jaffe’s method in mg/dL) − 0.224 ( r = 0.999, P < 0.001).
HbA1c has been measured by high-performance liquid chromatography (HPLC), using a set of calibrators assigned by the Japan Diabetes Society (JDS, normal range: 4.3–5.8%). According to the correlational analysis, HbA1c values in Japan were estimated to be 0.4% lower than those measured by the National Glycohemoglobin Standardization Programme (NGSP). To internationally standardize HbA1c values to NGSP units, 0.4% was added to the measured values and expressed as HbA1c corresponding to NGSP units in this study [ 13 ].
Primary and secondary outcomes
The primary outcome of this study was defined as the transition from any given stage to a more advanced stage of albuminuria, which was established using at least two consecutive urinary ACR measurements to reduce misclassification.
The secondary outcome was defined as annual decline rate of eGFR. For each individual, the rate of change in eGFR per year was determined using a simple regression analysis, with eGFR as a function of time in years, applied to all eGFR values obtained during the follow-up period. Then, the eGFR slope was expressed as percent per year by dividing the rate of change in eGFR by the baseline eGFR value. Subjects were excluded from the secondary endpoint analysis if they had <5 years of follow-up observation since the study entry.
Statistical analysis
Continuous variables were expressed as arithmetic mean ± standard deviation (SD) or geometric mean with 95% confidence interval (CI), as appropriate according to data distribution. Categorical data were expressed by actual frequencies and percentages. For statistical analyses, Student’s t -test, Pearson’s correlation analysis and multivariate linear regression analysis were conducted according to the appropriate situation. Cumulative incidence of transition of albuminuria stage was estimated by the Kaplan–Meier method and the statistical differences between the groups were compared by the log-rank test. Hazard ratio for reaching the endpoint was calculated using univariate and multivariate Cox proportional hazard model analyses. The following parameters were used as covariates: age, body mass index (BMI), systolic blood pressure, HbA1c, eGFR and urinary ACR value at baseline. P values <0.05 were considered significant. All statistical analyses were performed using the SAS version 9.2 (SAS Institute, Cary, NC).
Results
Baseline demographic and clinical characteristics
Among 733 patients who were assessed for eligibility during the period between January 2001 and December 2006, 6 patients who had malignant disease, 3 patients who had severe liver dysfunction and 1 patient who had undergone lower limb amputation were excluded. Finally, a total of 723 adult Japanese T2DM patients with normoalbuminuria ( N = 477) or microalbuminuria ( N = 246) were studied. There were 280 women and 443 men, and the mean (± SD) age was 63 ± 11 years (range, 20–90 years). Demographic and laboratory data of women and men at baseline are shown in Table 1 .
Gender-segregated demographic and laboratory data at baseline a
| Women ( N = 280) | Men ( N = 443) | |
| Age (years) | 65 ± 11 | 61 ± 11 |
| BMI (kg/m 2 ) | 24.4 ± 4.0 | 24.8 ± 3.9 |
| Duration of diabetes (years) | 13 ± 8 | 13 ± 8 |
| Retinopathy, none/simple/proliferative (%) | 49.3/37.1/13.6 | 51.1/36.7/12.2 |
| Medication for diabetes, none/OHA/insulin (%) | 17.5/48.9/33.6 | 21.0/52.8/26.2 |
| Systolic blood pressure (mmHg) | 138 ± 20 | 136 ± 18 |
| Diastolic blood pressure (mmHg) | 75 ± 12 | 79 ± 11 |
| Use of RAS blockers (%) | 33.9 | 43.6 |
| Use of other antihypertensive drugs (%) | 38.6 | 32.1 |
| Use of lipid-lowering agents (%) | 40.4 | 27.5 |
| History of cardiovascular disease (%) | 16.8 | 21.2 |
| Laboratory data | ||
| HbA1c (%) | 8.4 ± 1.6 | 8.1 ± 1.5 |
| Triglyceride (mg/dL) | 122 (115–131) | 127 (120–135) |
| Total cholesterol (mg/dL) | 211 ± 32 | 194 ± 35 |
| HDL cholesterol (mg/dL) | 55 ± 15 | 50 ± 14 |
| LDL cholesterol (mg/dL) | 127 ± 30 | 116 ± 28 |
| Creatinine (mg/dL) | 0.62 ± 0.17 | 0.84 ± 0.25 |
| eGFR (mL/min/1.73 m 2 ) | 79.4 ± 22.4 | 78.6 ± 21.4 |
| Urinary albumin (mg/g Cr) | 16.5 (14.5–18.9) | 21.0 (18.6–23.9) |
| Microalbuminuria (%) | 29.3 | 37.0 |
Data are expressed as percentage, mean ± standard deviation (SD) or geometric mean (95% CI). Abbreviations: OHA: oral hypoglycaemic agents.
Associations between lipid profiles and the progression of albuminuria (the primary outcome)
During the mean follow-up period of 4.3 ± 2.5 years (range: 0.1–8.4 years), 25 of 198 women (12.6%) and 35 of 279 men (12.5%) with normoalbuminuria and 18 of 82 women (22.0%) and 51 of 164 men (31.1%) with microalbuminuria progressed to micro- and macroalbuminuria, respectively. Two normoalbuminuric women (1.0%) progressed to macroalbuminuria. Firstly, interaction between gender and each serum lipid parameter on the primary outcome was tested by Cox proportional hazard model analysis, detecting a significant interaction with HDL cholesterol (P interaction = 0.04); therefore, the following analyses were conducted for men and women separately.
In men, HDL cholesterol was a significant predictor of the primary outcome in both the univariate and the multivariate Cox analyses. Logarithmically transformed triglyceride level was also a predictive indicator of the outcome in the univariate analysis but the statistical significance disappeared in the multivariate analysis after adjustment for covariates ( Table 2 ). In women, no serum lipid parameters were associated with the primary outcome in either univariate or multivariate model ( Table 2 ). Similar results were obtained when use of renin–angiotensin system (RAS) blockers and lipid-lowering agents and history of cardiovascular disease were incorporated into the model as dependent variables in either men or women. In the analyses limiting to patients with a follow-up period equal or >1 year ( N = 668), we also obtained the similar results.
Univariate and multivariate Cox proportional hazards regression analysis to determine the predictors of reaching the primary outcome (the progression to a more advanced stage of albuminuria)
| Women | Men | |||
| Variable at baseline | Hazard ratio (95% CI) | P-value | Hazard ratio (95% CI) | P-value |
| Univariate analysis | ||||
| Log [triglyceride (mg/dL)] | 1.233 (0.379–4.013) | 0.73 | 2.736 (1.264–5.921) | 0.01 |
| HDL cholesterol (mg/dL) | 0.997 (0.977–1.017) | 0.79 | 0.971 (0.954–0.988) | <0.01 |
| LDL cholesterol (mg/dL) | 1.002 (0.992–1.012) | 0.71 | 0.998 (0.991–1.006) | 0.66 |
| Multivariate analysis | ||||
| Log [triglyceride (mg/dL)] | 0.718 (0.156–3.316) | 0.72 | 0.832 (0.311–2.222) | 0.71 |
| HDL cholesterol (mg/dL) | 1.007 (0.982–1.034) | 0.57 | 0.976 (0.958–0.994) | 0.01 |
| LDL cholesterol (mg/dL) | 1.002 (0.991–1.013) | 0.76 | 0.999 (0.991–1.008) | 0.85 |
| Age (years) | 0.997 (0.966–1.030) | 0.87 | 1.005 (0.981–1.030) | 0.67 |
| BMI (kg/m 2 ) | 1.000 (0.916–1.091) | 0.99 | 1.010 (0.944–1.080) | 0.78 |
| Systolic blood pressure (mmHg) | 1.014 (1.000–1.027) | 0.04 | 1.015 (1.004–1.028) | 0.01 |
| HbA1c (%) | 1.135 (0.931–1.383) | 0.21 | 1.064 (0.899–1.258) | 0.47 |
| eGFR (mL/min/1.73 m 2 ) | 0.990 (0.975–1.005) | 0.20 | 0.997 (0.986–1.008) | 0.62 |
| Log [urinary albumin (mg/g)] | 3.303 (1.883–5.793) | <0.001 | 4.151 (2.714–6.350) | <0.001 |
As serum triglyceride levels in non-fasting blood samples are known to vary widely compared to those in fasting blood samples, we conducted further analysis limiting to patients in whom lipid profiles were obtained from fasting blood samples. In this sensitivity analysis, the association between lower HDL cholesterol levels and the primary outcome in men ( N = 297) was marginal (hazard ratio for an increment of 1 mg/dL HDL cholesterol 0.977, 95% CI 0.953–1.002, P = 0.07). Triglycerides or LDL cholesterol were not associated with the primary outcome (P = 0.46 or 0.85). In women ( N = 176), no variables in the lipid profile were also associated with the outcome.
Next, we classified the subjects into tertiles by HDL cholesterol levels to clarify the effect of HDL cholesterol treating as a categorical variable. Kaplan–Meier method revealed significant differences in terms of cumulative incidence of the primary outcome among the three groups in men (log-rank test, P < 0.001) but not in women (log-rank test, P = 0.87, Figure 1 ). Hazard ratio adjusted for logarithmically transformed triglyceride and LDL cholesterol levels in addition to the covariates indicated in the Material and methods section for patients in the third versus the first tertile was significantly high in men (hazard ratio 2.242, 95% CI 1.190–4.227, P = 0.01). In women, adjusted hazard ratio for patients in either the second or third tertile in reference to those in the first tertile was not significant. Either triglyceride or LDL cholesterol level treated as a categorical variable was not significantly associated with the primary outcome in men or women.
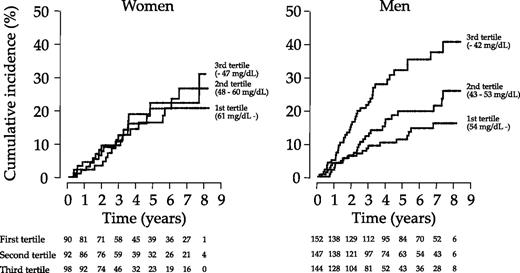
Cumulative incidence of reaching the primary outcome (transition to more advanced stage of albuminuria) among three groups classified into tertile by serum HDL cholesterol levels in women (left panel) and men (right panel). The difference among the three groups was statistically significant as determined by the log-rank test in men (P < 0.001) but not in women (P = 0.87).
Finally, Cox model analyses were performed separately for normoalbuminuric and microalbuminuric patients. In normoalbuminuric patients, HDL cholesterol level was not associated with the primary outcome in either univariate or multivariate analyses in either sex. In microalbuminuric patients, HDL cholesterol level was a significant predictor of the primary outcome in both the univariate (hazard ratio 0.971, 95% CI 0.950–0.991, P < 0.01) and multivariate analyses (hazard ratio 0.969, 95% CI 0.946–0.993, P = 0.01) in men. In women, these associations were not observed in either univariate or multivariate analysis. No other serum lipid parameter (triglycerides and LDL cholesterol) for either gender were associated with reaching the outcome in normo- or microalbuminuric patients.
Associations between HDL cholesterol levels and eGFR slope (the secondary outcome)
A total of 264 men and 135 women had sufficient follow-up data to qualify for secondary outcome analysis. At baseline, subjects with a follow-up period of at least 5 years were younger (62 ± 10 versus 64 ± 12 years, P < 0.01), more likely to have higher systolic blood pressure (138 ± 19 versus 135 ± 19 mmHg, P = 0.04) and lower HbA1c (7.4 ± 1.2 versus 8.3 ± 1.7%, P < 0.001) than those with a follow-up period of <5 years follow-up. Whereas, there were no significant differences in lipid parameters, logarithmically transformed urinary ACR and eGFR between two groups. During the follow-up period, at least three measurements of eGFR (mean: 22 times) were used for the calculation of eGFR slope. The mean rate of changes in eGFR were −2.11 ± 2.07 and −1.84 ± 2.13 mL/min/1.73 m 2 /year in women and men, respectively. In both men and women, lower HDL cholesterol and higher logarithmically transformed triglyceride levels were significantly associated with greater eGFR slope in the univariate analysis ( Table 3 ). In the multivariate regression analysis, HDL cholesterol remained statistically significant only in men ( Table 3 ). Similar results were obtained after the inclusion of independent variables including use of RAS blockers and lipid-lowering agents and history of cardiovascular disease in the model.
Univariate and multivariate regression analysis to determine the predictors of the secondary outcome (annual decline in eGFR, percentage per year)
| Variable at baseline | Women | Men | ||
| Univariate analysis | r | P-value | r | P-value |
| Log [triglyceride (mg/dL)] | −0.271 | <0.01 | −0.167 | <0.01 |
| HDL cholesterol (mg/dL) | 0.241 | <0.01 | 0.229 | <0.001 |
| LDL cholesterol (mg/dL) | −0.071 | 0.41 | 0.008 | 0.90 |
| Multivariate analysis | Standardized estimate | P-value | Standardized estimate | P-value |
| Log [triglyceride (mg/dL)] | −0.121 | 0.24 | 0.005 | 0.94 |
| HDL cholesterol (mg/dL) | 0.109 | 0.29 | 0.193 | <0.01 |
| LDL cholesterol (mg/dL) | −0.058 | 0.48 | −0.008 | 0.89 |
| Age (years) | −0.025 | 0.79 | −0.046 | 0.49 |
| BMI (kg/m 2 ) | 0.079 | 0.39 | 0.059 | 0.33 |
| Systolic blood pressure (mmHg) | −0.013 | 0.88 | −0.230 | <0.001 |
| HbA1c (%) | −0.206 | 0.02 | −0.128 | 0.03 |
| eGFR (mL/min/1.73 m 2 ) | −0.017 | 0.86 | −0.017 | 0.79 |
| Log [urinary ACR (mg/g)] | −0.241 | <0.01 | −0.272 | <0.001 |
Discussion
In this single-centre observational cohort study, we have found gender differences in the association between HDL cholesterol and the progression of DKD in type 2 diabetic patients with early stage of nephropathy. Lower HDL cholesterol levels were associated with the rapid progression of DKD, based on the transition to a more advanced stage of albuminuria and steeper eGFR slope in men overall in this cohort. These findings were independent of other variables that are well-known risk factors for the development of DKD. In contrast, these associations were not observed in diabetic women in the multivariate analyses. No other lipid parameters for men or women were associated with the progression of DKD in the multivariate analyses.
Although the reasons for the gender difference in the association between HDL cholesterol and the progression of DKD were not able to be clarified in this observational study, several explanations are speculated. Firstly, HDL is well documented to exhibit potent antioxidant effects in addition to promoting the efflux of cholesterol from cells [ 14 ]. Animal studies have evaluated the gender differences between renal injury and the role of oxidative stress [ 15 , 16 ]. Interestingly, a recent study reported that the administration of antioxidants reduced renal oxidative stress in male but not in female spontaneously hypertensive rats [ 16 ]. Therefore, the difference in the responses to antioxidant effects of HDL may explain partly the gender-specific effects of HDL cholesterol on DKD. Secondly, gender differences may be affected by sex steroids such as estradiol, progesterone and testosterone. Estradiol and progesterone have been suggested to exert protective effects against renal injury and testosterone promotes renal damage [ 15 ]. Nonetheless, effects of these sex steroids are less likely to contribute to the susceptibility of renal damage in men, as the mean age of women in our study was old enough to reach menopause.
In contrast to our results, triglycerides and LDL cholesterol were reported to be the risk factors for the progression of DKD in the UK Prospective Diabetes Study [ 2 ]; however, a recent study from China showed that among serum lipid profiles, only HDL cholesterol was associated with the progression of albuminuria [ 5 ]. Therefore, ethnic differences may exist in the lipid profiles while assessing the risks of renal outcomes.
Our findings may indicate a potency of drug discovery of increasing HDL medication to inhibit DKD in men; however, treatment with torcetrapib, a synthesized inhibitor of cholesteryl ester transfer protein (CETP), paradoxically increased mortality and cardiovascular events [ 17 ]. Clinically available drugs such as fibrates, statins, ezetimibes and nicotinate derivatives are, to a varying degree, known to increase HDL cholesterol levels; therefore, whether these drugs exert protective effects against the progression of DKD needs to be addressed.
Our study has several limitations. Firstly, the number of women both at baseline and with reaching the primary endpoint was small, yielding less statistical power to see the association between lipid parameters and the outcome. Secondly, in this cohort, the proportion of patients using lipid-lowering agents was higher in women than men. This may reduce the effect of lipid parameters on the progression of DKD in women, although the results did not change when lipid-lowering agents were included as a dependent variable in the multivariate analyses. Thirdly, we did not evaluate the time-dependent changes in blood pressure, lipid parameters, HbA1c or BMI during follow-up period. Fourthly, we did not evaluate the subfractions of HDL such as HDL 2 and HDL 3 , and apoproteins (Apo) A-I and A-II, which are the main protein components of HDL. Surprisingly, high levels of HDL 3 and ApoA-II have been reported to be significant predictors of microalbuminuria in FinnDiane Study [ 18 ]. Changes in HDL cholesterol levels are not necessarily correlated with the changes in the HDL subfractions [ 19 ]; hence, the predictive value of HDL subfractions and Apo in diabetic patients needs to be further elucidated. Finally, this study was carried out in a single urban university hospital, which may not be representative of the entire Japanese T2DM patient population. The generalizability of these findings will need to be confirmed in future studies.
In conclusion, this single-centre observational cohort study provided evidence that lower HDL cholesterol levels seem to be associated with the progression of DKD in men but the association is not observed in women. These findings need to be confirmed in studies with a larger sample size and in a multicenter design.
Conflict of interest statement . None declared.


Comments